Tag Archive for: corporations

Net Promoter Calculator

Be Skeptical of High Net Promoter Scores

Recently, a “leading provider of civil and criminal justice technology solutions for public safety, investigation, corrections and monitoring” published a press release touting a Net Promoter Score of 82. If you think that’s incredible, then I think you may be on to something.

Read more

mergers and acquisitions graphic

Infographic – Mergers & Acquisitions – April 2017

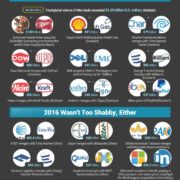
This MarketPoint infographic explores the high-stakes world of mergers & acquisitions (M&As). Did you know 2015 was a record year for M&As? The total global M&A volume that year exceeded $4.25 trillion U.S. dollars. And a “trillion” is a lot! If you stacked just one trillion U.S. dollar bills on your kitchen table, the stack would reach 63,000 miles into space and would weigh more than the Golden Gate Bridge! But 80% of M&A deals fail. So if you’re thinking about playing this risky game, you’d better download our infographic and keep it handy. All sources cited.

© 2017 MarketPoint LLC, All Rights Reserved

Read more

sailboat navigate research

A Sailor’s Perspective on Research

Sailors carry charts to help them avoid the shallows and find the channels – or seek the counsel of local captains and fishermen when they enter new waters. Coaches and managers of professional sports teams spend countless hours reviewing videotapes of their next opponent. Generals need to know their opponents’ strength, their numbers, their locations and their political aims before waging battle. Read more

Brand Loyalty Whitepaper

Whitepaper – Brand Loyalty – 2016 February

This MarketPoint whitepaper explores aspects of brand loyalty: what makes customers loyal, why customers switch brands, and the value of loyalty programs. All sources cited.

© 2015 MarketPoint LLC, All Rights Reserved

Read more

Cybersecurity Infographic

Infographic – Cybersecurity in America – 2015 September

This cybersecurity infographic explores the risks associated with cybercrime and how organizations can help mitigate risk and protect their data. All sources cited.

© 2015 MarketPoint LLC, All Rights Reserved

Read more

Apple Infographic

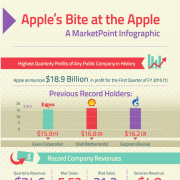
Infographic – Apple’s Bite at the Apple – 2015 February

This Apple Infographic explores the impact of Apple’s 2015 Q1 revenues, and the company’s size, relative to other large companies and to the S&P index. All sources cited.

© 2015 MarketPoint LLC, All Rights Reserved

Read more

Succession Planning Infographic

Infographic – Succession Planning in America – 2015 February

This Succession Planning Infographic explores the importance of succession planning in family businesses and corporations. All sources cited.

© 2015 MarketPoint LLC, All Rights Reserved

Read more

Innovation Infographic

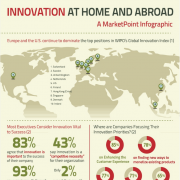
Infographic – Innovation – 2014 December

This Innovation Infographic from MarketPoint explores innovation, quantifying it domestically and internationally, and explains disruptive innovation. All sources cited.

© 2014 MarketPoint LLC, All Rights Reserved

Read more

Brand Value

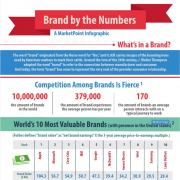
Infographic – Brand by the Numbers – 2014 August

This infographic on brand value explores the value of some of the world’s leading brands, including Apple, Microsoft, Coca-Cola, Google, Samsung, Disney, Lego, and others. All sources cited.

© 2014 MarketPoint LLC, All Rights Reserved

Read more

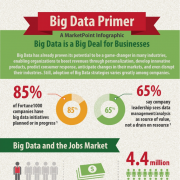
Big Data Primer Infographic

Infographic – Big Data Primer – 2013 November

Big Data has already proven to be a game-changer in many industries, enabling organizations to boost revenues, develop innovative products, predict consumer response, anticipate market changes, and disrupt industries. This Big Data Primer infographic explains the sources of Big Data and begins to quantify its impact on business and industry in simple terms. For executives and managers alike. All sources cited.

© 2013 MarketPoint LLC, All Rights Reserved

Read more