Tag Archive for: infographic

mergers and acquisitions graphic

Infographic – Mergers & Acquisitions – April 2017

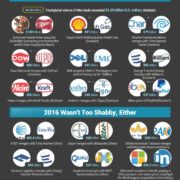
This MarketPoint infographic explores the high-stakes world of mergers & acquisitions (M&As). Did you know 2015 was a record year for M&As? The total global M&A volume that year exceeded $4.25 trillion U.S. dollars. And a “trillion” is a lot! If you stacked just one trillion U.S. dollar bills on your kitchen table, the stack would reach 63,000 miles into space and would weigh more than the Golden Gate Bridge! But 80% of M&A deals fail. So if you’re thinking about playing this risky game, you’d better download our infographic and keep it handy. All sources cited.

© 2017 MarketPoint LLC, All Rights Reserved

Read more

Black Friday Infographic

Infographic – Black Friday and Cyber Monday – 2016 November

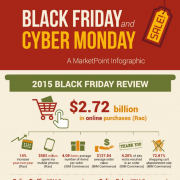
This infographic explores the economic impact of Black Friday, Cyber Monday, and Thanksgiving Day weekend sales, using the final statistics from 2015 (in forecast of 2016). The National Retail Federation had predicted a 3.6 percent increase for 2016 at the time of publication.

© 2016 MarketPoint LLC, All Rights Reserved
Read more

Family-Owned Businesses Infographic

Infographic – Family-Owned Businesses – 2016 May

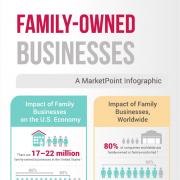
This MarketPoint infographic explores the impact of family-owned businesses on the U.S. and world economies. Colorful charts and tables help explain the distribution of businesses by size and by gender and the revenue contribution by gender of ownership, and list the top 10 family businesses in America, showing size and ownership. All sources cited.

© 2016 MarketPoint LLC, All Rights Reserved
Read more

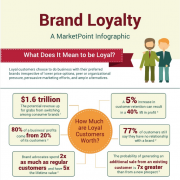
Brand Loyalty Infographic

Infographic – Brand Loyalty – 2016 March

This MarketPoint infographic on Brand Loyalty explores what it means to be loyal, what makes customers loyal, why customers switch brands, and the value of loyalty programs. All sources cited.

© 2016 MarketPoint LLC, All Rights Reserved
Read more

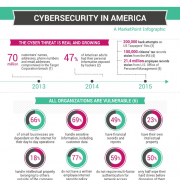
Cybersecurity Infographic

Infographic – Cybersecurity in America – 2015 September

This cybersecurity infographic explores the risks associated with cybercrime and how organizations can help mitigate risk and protect their data. All sources cited.

© 2015 MarketPoint LLC, All Rights Reserved
Read more

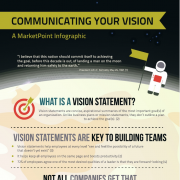
Vision Infographic

Infographic – Vision – 2015 July

This MarketPoint infographic explores organizational vision, vision statements, and how to champion the vision. All sources cited.

© 2015 MarketPoint LLC, All Rights Reserved
Read more

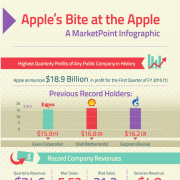
Apple Infographic

Infographic – Apple’s Bite at the Apple – 2015 February

This Apple Infographic explores the impact of Apple’s 2015 Q1 revenues, and the company’s size, relative to other large companies and to the S&P index. All sources cited.

© 2015 MarketPoint LLC, All Rights Reserved
Read more

Succession Planning Infographic

Infographic – Succession Planning in America – 2015 February

This Succession Planning Infographic explores the importance of succession planning in family businesses and corporations. All sources cited.

© 2015 MarketPoint LLC, All Rights Reserved

Read more

Four identical white bicycles showing no innovations since the 1970s

Innovation at Home and Abroad

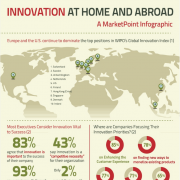
Picture a map of the world. Now think of the word “innovation.” Does one country stand out? Most Americans consider the United States the world leader. But the facts on this Innovation Infographic say otherwise.

Read more

Innovation Infographic

Infographic – Innovation – 2014 December

This Innovation Infographic from MarketPoint explores innovation, quantifying it domestically and internationally, and explains disruptive innovation. All sources cited.

© 2014 MarketPoint LLC, All Rights Reserved

Read more